C# でグラフを描画するには WinForms の Chart を使うことが多いと思いますが、OxyPlot を使うと簡単に描画できるようです。OxyPlotとは?については公式サイトを見てください。
リアルタイムではなく、一度にプロットするための方法については Qiita やらサンプルコードに書いてあるのでキーワード検索してみてください。
つくるもの
りあるたいむにうごく!(かっこいいね!) ぐらふもほぞんできるよ!

つくってみよう
今回は .NET Core 3.1 で作成します。
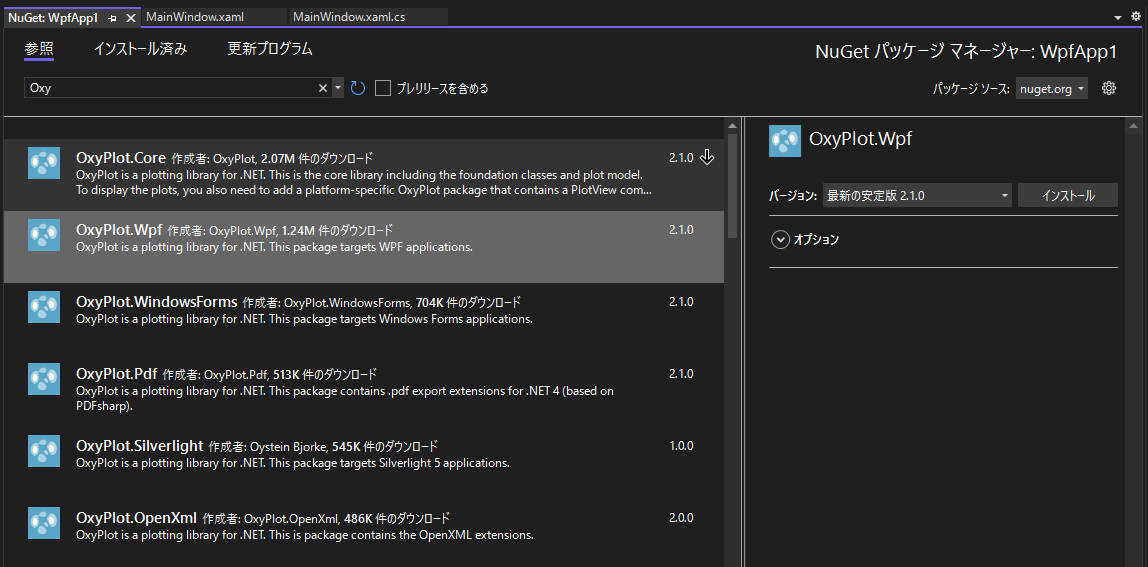
NuGet にて OxyPlot.Wpf を導入します。
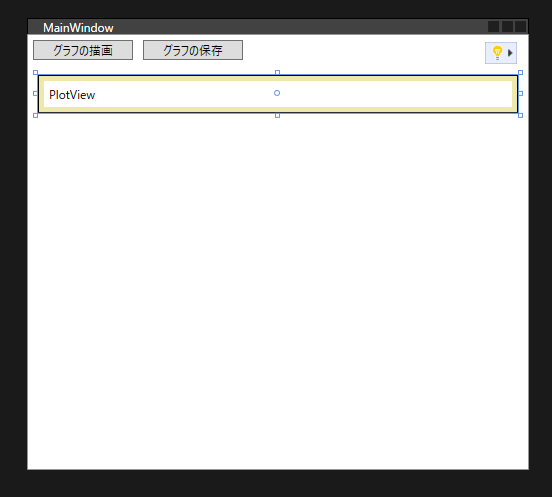
XAML にて OxyPlot を表示するエリアを作ります。
<Window x:Class="WpfApp1.MainWindow"
        xmlns="http://schemas.microsoft.com/winfx/2006/xaml/presentation"
        xmlns:x="http://schemas.microsoft.com/winfx/2006/xaml"
        xmlns:d="http://schemas.microsoft.com/expression/blend/2008"
        xmlns:mc="http://schemas.openxmlformats.org/markup-compatibility/2006"
        xmlns:local="clr-namespace:WpfApp1"
        xmlns:oxy="http://oxyplot.org/wpf"
        mc:Ignorable="d"
        Title="MainWindow" Height="450" Width="500">
    <Grid>
        <Grid.RowDefinitions>
            <RowDefinition Height="1*"/>
            <RowDefinition Height="9*"/>
        </Grid.RowDefinitions>
        <StackPanel Orientation="Vertical">
            <StackPanel Orientation="Horizontal">
                <Button x:Name="DrawButton" Margin="5" Content="描画開始" Width="100" Click="Draw_Button"/>
                <Button x:Name="StopButton" Margin="5" Content="描画停止" Width="100" Click="Stop_Button"/>
                <Button x:Name="SaveButton" Margin="5" Content="グラフの保存" IsEnabled="false" Width="100" Click="Save_Button"/>
            </StackPanel>
        </StackPanel>
        <oxy:PlotView x:Name="PlotView" Grid.Row="1"/>
    </Grid>
</Window>
あとはコードビハインドを書いていきます。MVVMでもできるようですが、べた書きします。
using System;
using System.Threading.Tasks;
using System.Windows;
using OxyPlot;
using OxyPlot.Series;
using OxyPlot.Axes;
using System.Threading;
using Microsoft.Win32;

public partial class MainWindow : Window
{
    // OxyPlot のモデルとコントローラー
    PlotModel plotModel { get; } = new PlotModel();
    LineSeries lineSeries { get; } = new LineSeries();
    bool cancelFlag = false;

    public MainWindow()
    {
        InitializeComponent();
        GraphSetup();
    }

    //グラフの見た目をつくる
    void GraphSetup()
    {
        // X軸とY軸の設定
        var AxisX = new LinearAxis()
        {
            Position = AxisPosition.Bottom,
            TitleFontSize = 16,
            Title = "X軸"
        };

        var AxisY = new LinearAxis()
        {
            Position = AxisPosition.Left,
            TitleFontSize = 16,
            Title = "Y軸"
        };

        plotModel.Axes.Add(AxisX);
        plotModel.Axes.Add(AxisY);
        plotModel.Background = OxyColors.White;

        //折れ線グラフの設定
        lineSeries.StrokeThickness = 1.5;
        lineSeries.Color = OxyColor.FromRgb(0, 100, 205);

        plotModel.Series.Add(lineSeries);

        PlotView.Model = plotModel;
    }

    void Draw_Button(object sender, RoutedEventArgs e)
    {
        //描画されているグラフをクリア
        lineSeries.Points.Clear();
        cancelFlag = false;
        DrawButton.IsEnabled = false;
        SaveButton.IsEnabled = false;
        StopButton.IsEnabled = true;

        // 非同期をキャンセルするためのトークン
        using (var tokenSource = new CancellationTokenSource())
        {
            Draw(tokenSource);
        }
    }

    void Stop_Button(object sender, RoutedEventArgs e)
    {
        cancelFlag = true;
        StopButton.IsEnabled = false;
        SaveButton.IsEnabled = true;
        DrawButton.IsEnabled = true;
    }

    void Save_Button(object sender, RoutedEventArgs e)
    {
        var dlg = new SaveFileDialog
        {
            Filter = "BMP形式|*.bmp",
            DefaultExt = ".bmp"
        };
        if (dlg.ShowDialog(this).Value)
        {
            var ext = System.IO.Path.GetExtension(dlg.FileName).ToLower();
            switch (ext)
            {
                case ".bmp":
                    PlotView.SaveBitmap(dlg.FileName, 0, 0);
                    break;
                    //他の拡張子があるならば追加
            }
        }
    }

    async Task Draw(CancellationTokenSource tokenSource)
    {
        int deg = 0;
        while (true)
        {
            if (cancelFlag)
            {
                tokenSource.Cancel();
                return;
            }

            //とりあえず皆大好き sin 波
            var val = Math.Sin(deg * (Math.PI / 180));
            lineSeries.Points.Add(new DataPoint(deg, val));
            plotModel.InvalidatePlot(true);
            deg++;
            await Task.Delay(10);
        }
    }
}
これで動かすと、スケールが変化するだけでグラフが水平移動しません。
水平移動したい場合は DataPoint で追加していったデータの最後を消します。例えばプロット数が 720 (2周期)を超えたらデキューするような条件をつけてあげます。
async Task Draw(CancellationTokenSource tokenSource)
{
    int deg = 0;
    while (true)
    {
        if (cancelFlag)
        {
            tokenSource.Cancel();
            return;
        }

        //データ数が 720 を超えたらデキューしていく
        if (lineSeries.Points.Count > 720)
        {
            lineSeries.Points.RemoveAt(0);
        }

        //とりあえず皆大好き sin 波
        var val = Math.Sin(deg * (Math.PI / 180));
        lineSeries.Points.Add(new DataPoint(deg, val));
        plotModel.InvalidatePlot(true);
        deg++;
        await Task.Delay(1);
    }
}
このようにすると、一番上で示したようなグラフが表示されます。ちなみに、グラフ画像を保存するとこんな感じです。
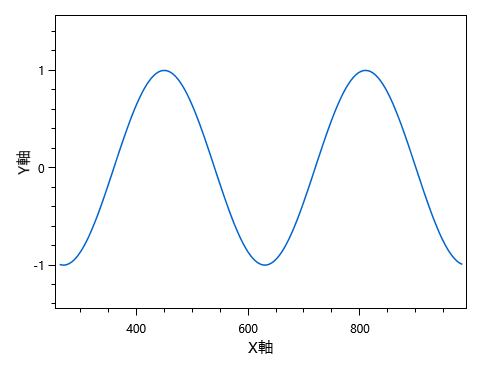
ここでは、sin 波のグラフを作成しましたが、Arduino からのデータを受け取って描画することもできます。なにかを計測するためのアプリを作る場合などに役立ちそうです。
Github にもサンプルコードを置いておきます。
参考
参考にしたサイトです。ありがとうございます。
OxyPlot の設定に関するプロパティなど qiita.com
Task のキャンセルについて qiita.com